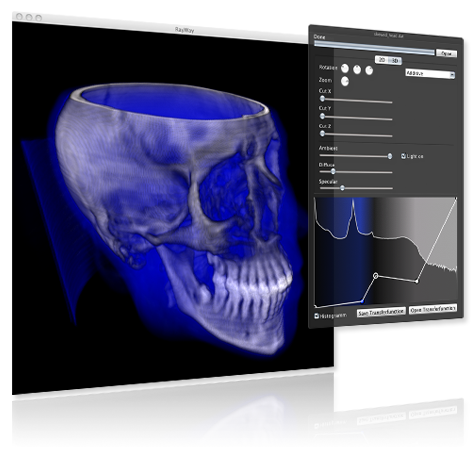
In part of the lecture Visualization at the Vienna University of Technology together with Sebastian Paulmichl the Mac OSX program RayWay was developed – a program to visualize volumetric data, e.g. from a MRT. It allows users to navigate in 3D through data, set the color and transparency of a specific material to see through layers, as well as to slice the data set.
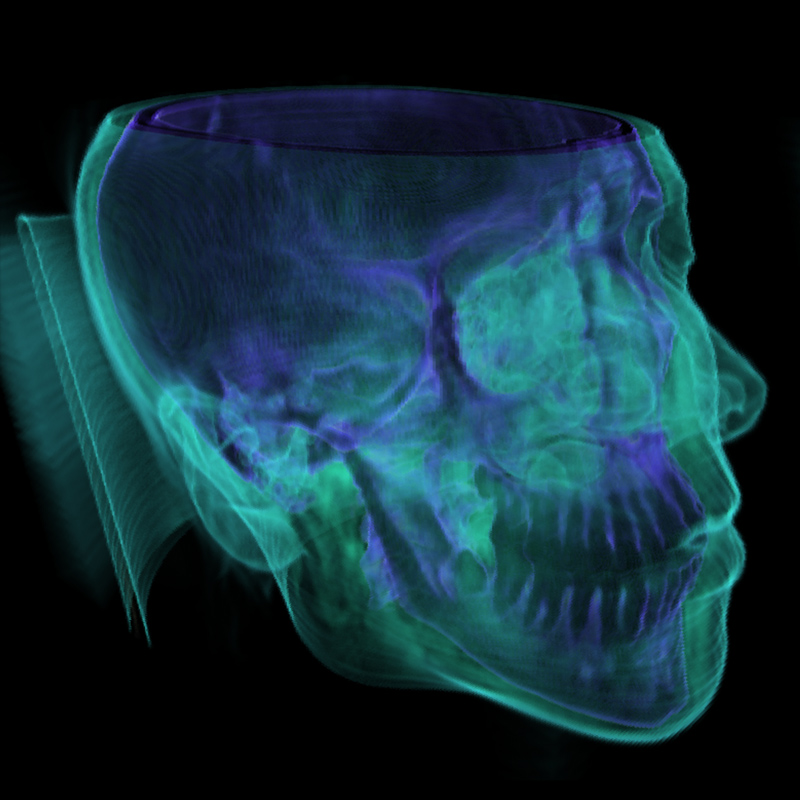
Visualization of volumetric data
Following features are supported:
- Visualization techniques: Average, MIP and Accumulate
- Rotation around x-, y- and z-axes
- Zooming
- Slicing through x-, y- and z-axes
- Shading model
- Interactive transform function with histogram
- Saving transfer function
You can download RayWay here.
You must be logged in to post a comment.